
Core Modules and Management Areas for SOC Operations
IBM QRadar is a powerful SIEM platform that enables Security Operations Center (SOC) teams to centrally manage incident detection, analysis, and response processes. This article covers QRadar’s core modules, operational use cases, and practical management areas in detail.
Dashboard Management
What is a Dashboard?
A dashboard is a monitoring panel within QRadar where events, flow data, offenses, and system metrics are visualized. It is the starting point of daily operations for SOC analysts.
In SOC operations, multiple dashboards are typically used for different purposes:
- Threat & Security Monitoring
- System Monitoring
- Custom Customer Dashboard
- EPS & Performance Monitoring
Important Notes:
- By default, the System Monitoring dashboard is presented.
- Users can create their own custom dashboards.
- Administrators can define shared dashboards.
Changing dashboards only affects the view, not the underlying data.
New Dashboard
Used to create a new dashboard.
It starts empty and is configured by adding the following widgets:
- Offenses
- Event Count
- Flow Count
- Top Source IP
- Top Categories
- Custom Search Results
Use Cases:
- Customer-based SOC panels
- Daily SOC health-check screen
- EPS tracking
- Attack trend analysis
Rename Dashboard
Used to change the name of a dashboard.
Naming conventions are critical in a SOC environment. For example:
- System Monitoring
- SOC Daily Health Check
- Customer-A Authentication Monitoring
Renaming does not change the content.
Delete Dashboard
Allows the deletion of unused or test-purpose dashboards.
This action:
- Streamlines the dashboard list
- Reduces operational clutter
- Cleans up unnecessary visualizations
Add Item (Adding Widgets)
This is the most important function of the dashboard.
Widget types that can be added:
- Event Count
- Flow Count
- Offenses
- Top Sources
- Top Categories
- Custom AQL Search
Widgets can be arranged via drag-and-drop, resized, and displayed in different visualization types (bar chart, pie chart, table).
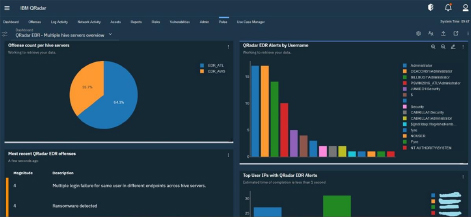
Offense Management
The Offense screen is the central management area for security violations created as a result of correlation rules.
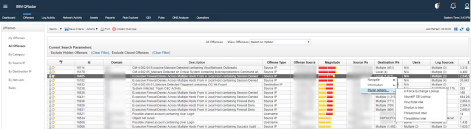
Each offense contains the following:
- Triggering rule
- Source / Destination IP
- Magnitude score
- Event and flow count
- Log sources
- Start time
Left Menu Structure
- My Offenses → Events assigned to the user
- All Offenses → All open offenses across the system
- By Category → Authentication, Malware, Recon, etc.
- By Source IP
- By Destination IP
- By Network
What is Magnitude?
The magnitude score is a combination of the following three parameters:
- Severity
- Credibility
- Relevance
This score determines the priority of the offense and forms the basis of the SOC triage process.
Top Menu Functions
- Search
- Save Criteria
- Assign
- Close
- Add Note
- Group View
In SOC processes, adding notes and assigning offenses is critical for SLA tracking.
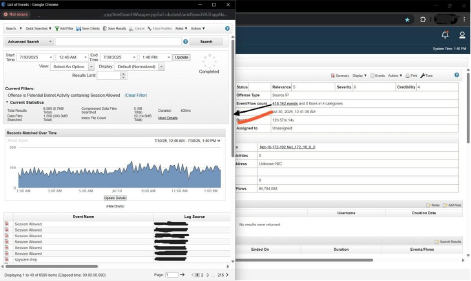
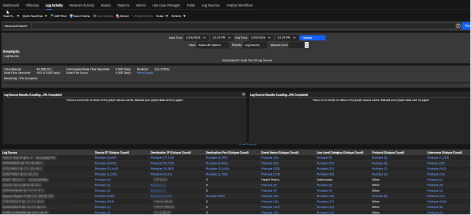
Log Activity
Log Activity is the area where raw events received by QRadar are analyzed.
This screen:
- Shows raw data prior to correlation
- Is critical for incident investigation
- Is heavily used in rule tuning processes
Search and Filtering
- Quick Search
- Add Filter
- Save Criteria
- Save Results (CSV/Excel)
- Advanced Search (AQL)
AQL (Ariel Query Language) is used for advanced searches and is particularly important in detection engineering work.
Display Options
- Real-time events
- Historical time range
- Normalized view
- Raw log view
The normalized view shows fields parsed by the DSM.
The raw log view shows the raw log as received from the device.
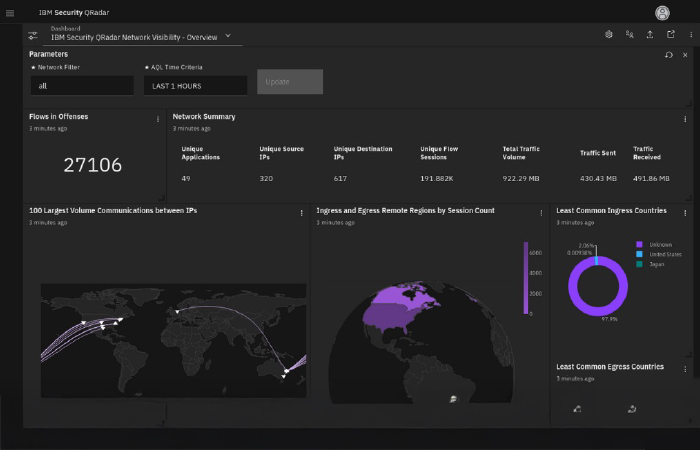
Network Activity
Network Activity is the area where flow data is examined.
Flow data contains:
- Source IP
- Destination IP
- Port
- Protocol
- Byte count
- Session duration
This area is particularly used for detecting:
- Data exfiltration
- Lateral movement
- Suspicious outbound traffic
- Port scanning
.
Assets Module
The Assets screen lists assets that QRadar has automatically discovered or those added manually.
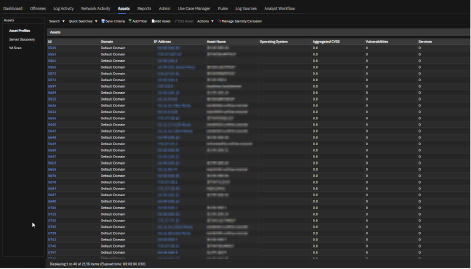
It provides context for SOC analysts:
- Operating system
- Domain information
- Open services
- Vulnerability scores (CVSS)
- Last Seen information
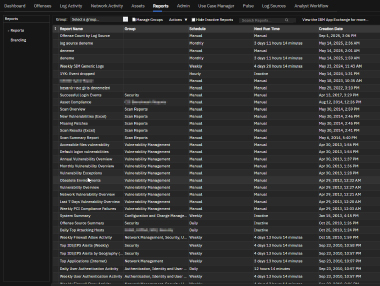
Reports
The Reports module enables reporting of event and network data.
Use cases:
- Monthly SOC reports
- SLA tracking
- Management presentations
- Customer briefings
Reports:
- Manual; Daily, Weekly, Monthly
can be scheduled to run. Output can be obtained in PDF, HTML, and CSV formats.
Use Case Manager (UCM)
Use Case Manager is the central management screen for the correlation rules in QRadar.
For SOC teams, it answers the following question:
“Which attack scenarios do we have active rules for?”
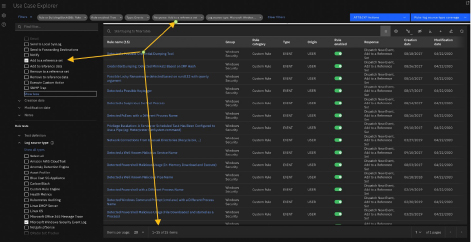
Rule List
Information displayed:
- Rule Name
- Group
- Type (Event / Flow / Common)
- Origin (System / Custom)
- Enabled / Disabled
- Response
- Creation / Modification Date
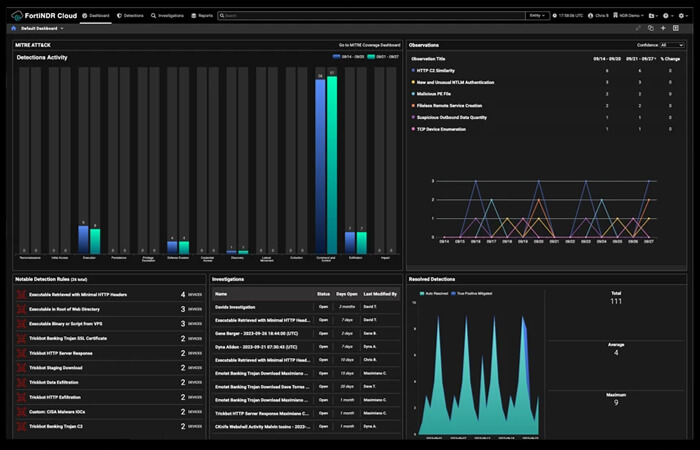
MITRE ATT&CK Integration
Rules:
- Tactic
- Technique
- Mapping confidence
can be mapped on these dimensions.
This feature is of great importance in detection coverage analyses.
IBM QRadar is not just a log collection system; with its event correlation, threat analysis, asset context, network traffic analysis, and reporting capabilities, it is an end-to-end SOC operations platform.
Vakkas AKYÜZ
Defensive Security Engineer
Latest Posts